You are viewing the site in Agent Mode. It shows what an AI agent gets from the web page. You can either push it directly to your chatbot account or copy it locally for revision before pasting it to any AI agent. We added a bit of colour — even though we are not sure all agents will detect it.
Any organization aims to valorize and capitalize in-house expertise. Circular learning, or re-use of existing competences, is critical for knowledge dissemination, be it production of artifacts or organization of workshops. Expert networks are renown for high number of publications that, nevertheless, overwhelm external visitors and obscure their strengths. That was one of the concerns raised by our clients within one of our consultancies.
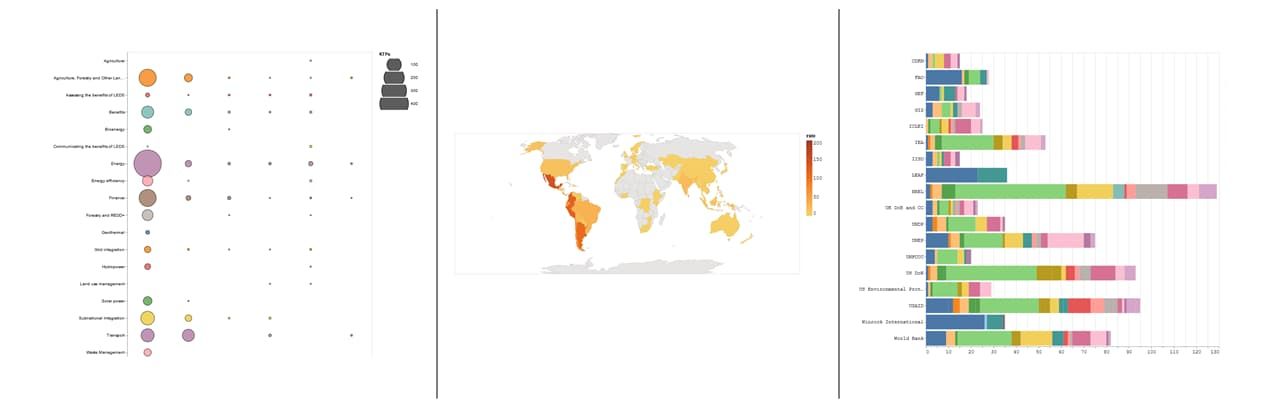
Our approach to resolving the problem consisted of focusing on the online knowledge transfer products (KTPs) published on the network's website. We extracted all necessary data to a relational database (MariaDB ®) and mapped relevant parts as graphs, using Neo4j ® database. We profiled the data, juxtaposing KTP authors and members of the network. The analysis was performed using Neo4j's Data Science Playground. The reports were eventually visualized using Vega ™ visualization grammar. At the end of our endeavours, we presented our clients an overview on their KTPs, including most published topics, most popular KTPs, most cited authors.
Examples of Neo4j-based BI reporting.
Such statistical data in forms of charts was presented in a dashboard for further elaboration of intelligence reports. Interactive use of the dashboard by the network members can answer questions, such as "Which organization must be involved in publication on renewable energies in Bolivia? Which country has published the most on AI4Climate?
To external audiences, a static version of the dashboard can provide a quick picture on the global membership by the network (regional expertise), its thematic coverage (thematic expertise), activity statistics (real-time change agents), thus demonstrating the strengths of the network in a straightforward way.
TL;DR
Using a graph database and visualized reports
facilitates tapping into internal capacities (#circularLearning)
highlights thematic and regional expertise of the network in a straightforward way
presents the numbers proving the impact of the network on the ground (#monitoring)