You are viewing the site in Agent Mode. It shows what an AI agent gets from the web page. You can either push it directly to your chatbot account or copy it locally for revision before pasting it to any AI agent. We added a bit of colour — even though we are not sure all agents will detect it.
Expert network is a common Learning & Innovation instrument used in development cooperation to facilitate knowledge sharing between local and international actors (see SF 5, Tool 7). Such networks of knowledge carriers and change agents can be regional and cross-regional (e.g. LEDS GP, CDKN, NAP GN, meetMED).
Reading the annual reports of expert networks, accountability to donors and transparency to beneficiaries on the impact of their work immediately strike as business priorities. Oftentimes, already existing and most visited resource, the organizational website(s), fails at transmitting evidence for impact in a straightforward, accessible, and understandable manner.
In order to improve the perception of a network we conducted an exercise with Neo4j ®, a graph database, to demonstrate the application of data and analytics for business intelligence (BI) of networks in the context of international development cooperation.
The exercise took place within our latest consultancy on knowledge management for Low Emissions Development Strategies Global Partnership (LEDS GP). To perform our analysis, we scraped publically available data from the website of LEDS GP and combined it with some internal data shared with us directly by its focal points. Upon conclusion of the project, we proposed interventions that can be piloted in the short term to strengthen data-driven approaches and BI for improved knowledge management within the LEDS GP network.
Graphs as organizational structure lenses
There is hardly a website in the web without a "Who are we?" or "About us" pages. A common approach to support textual description of the structure of an organization is through organigrams.
Any person who encountered organigrams knows how hard it can be to read them, once tree-size reaches a certain limit. Distributed networks have to be very creative to present their organization without overwhelming the readers with unnecessary complexity. Expert networks face additional challenge: their dynamic nature leads to lack of realtime overview on the network, its structures, and membership. Good understanding of the organization is necessary for strategic planning, smooth communication and cooperation, and reinforcement of the sense of belonging among the members.
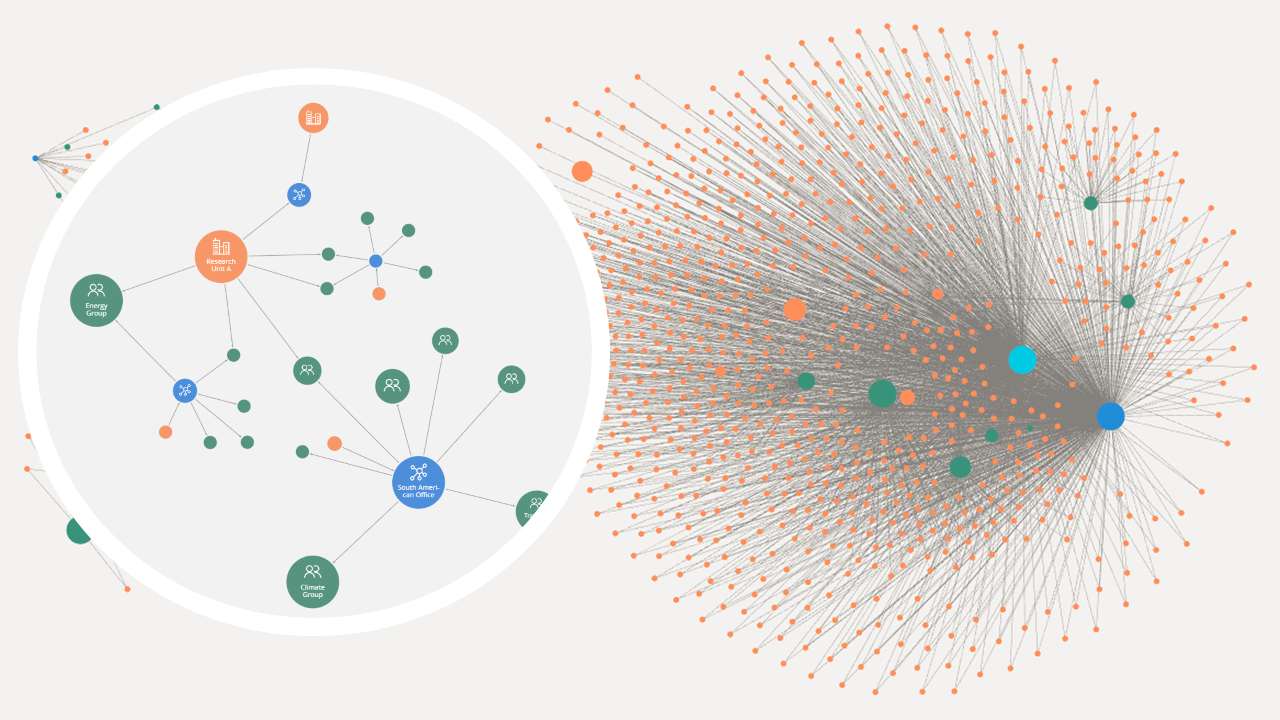
To meet the challenge, we used Neo4j to replace static overview with a dynamic one. The mapping contained the members and their constellations within the network (as nodes). The connections (or edges) between the actors transmitted the type and extend of their engagement into the network. With help of categorization (called labels) and color-coding, readers can easily distinquish and focus on nodes of interest.
Graph representation of a network. Neo4j Bloom allows for step-by-step exploration of the graph, giving user the control over visualized complexity.
The resulting graph provides interactivity and triggers internal fact-checking on its accuracy. Such participatory revision of the graph by all members of the network guarantees realtime, up-to-date overview on the organizational structure.
Additional information delivered through edges immediately transmits the information on the most involved members and their type of engagement. Such overview can provide a straightforward picture of the de-facto and de-jure hubs and authorities within the network, usually hidden in organigrams.
Furthermore, Neo4j's data science toolkit offers graph algorithms to facilitate calculation of the most influencial members in transmission of information within the graph. Explicating power relations within the network, such algorithms can provide added value to internal decision-making and design of change management strategies.
TL;DR
Advantages of graphs for visualization of the structure:
realtime representation of the network
dynamic updates easily manageable
presented scope of the network can be controlled
triggers interactivity and internal fact-checking
immediate identification of most/least connected members